
Serving web maps from our django site
Serving web pages with Django from a spatially enabled database should allow us to easily place interactive maps on our pages, and provide intelligent spatial query capabilities at the back end. The emphasis on interactive (or slippy) maps, means that we will have to have a javascript component to handle the client interaction. There are many javascript mapping libraries available today, including OpenLayers which is included with GeoDjango and Cesium which does 3D. I’ll demonstrate a map using OpenLayers here but then I want to focus on Leaflet which is very popular due to its small footprint and good performance.
This post builds on the basic django/postgis server that I documented in my earlier series: A production ready web mapping toolkit.
The code discussed in the previous posts is available, just clone my repository:
$ git clone --recursive https://github.com/geoanalytic/cookie-cutter-demo.git
note that the --recursive option is required because I am using another repository for the PostGIS container build. You will still need to edit some of the settings and environment variables, including the host domain, before you can use the site.
If you already have a django site that you want to serve maps from, then carry on, but if not then following the process discussed in the above posts should get you up and running with everything you need.
Basic Requirements
Before we begin, let’s make sure we have everything we need:
- A working django website, pulling data from
- A PostgreSQL/PostGIS database, with at least one table containing
- Geographic data. In our simple case it will be a table of Point features. Here is the data model:
# geodata/models.py

# -*- coding: utf-8 -*-
from __future__ import unicode_literals, absolute_import
from django.utils.encoding import python_2_unicode_compatible
from django.contrib.gis.db import models

# A simple point location with a name
@python_2_unicode_compatible
class Location(models.Model):
    name = models.CharField(max_length=50, default = 'Unknown location')
    mpoint = models.PointField()

    def __str__(self):
        return self.name
In order to create/read/update/delete some Location data, I register the model with the admin:
# geodata/admin.py

from django.contrib.gis import admin
from .models import Location

# subclass the GeoModelAdmin to use the locally hosted OpenLayers library
class olGeoModelAdmin(admin.GeoModelAdmin):
    openlayers_url = 'OpenLayers.js'

# subclass the OSMGeoAdmin to use the locally hosted OpenLayers library
class olOSMGeoAdmin(admin.OSMGeoAdmin):
    openlayers_url = 'OpenLayers.js'

# register an admin tool for the Location model
# admin.site.register(Location, olGeoModelAdmin)
# the OSMGeoAdmin tool uses the openstreetmap data for a nicer experience
admin.site.register(Location, olOSMGeoAdmin)
The bits about sub-classing the OpenLayers.js library are only necessary if we are serving our site from a secure (HTTPS) server.
Goals and Approach
At the end of this post, I want to have:
- the home page of my webtest.positionbot.com site show a slippy map with markers placed from the
locationtable stored in the database.
If I get ambitious, I’d also like to have:
- a spatial search function that will select features within a specified radius of a mouse click
- and maybe a distance calculation performed by the database and displayed on the map
There are several ways we could accomplish these goals, but the two I will cover here are:
- The minimum required code, which means an html file which loads the (hosted) javascript and gets a geojson feed from our django site.
- Using an already built django package that hooks into the admin, forms, and provides a set of configuration options that makes it possible to serve lots of custom map pages without getting our hands dirty with (too much) javascript.
Phase 1: Serve a Minimal Slippy Map With OpenLayers
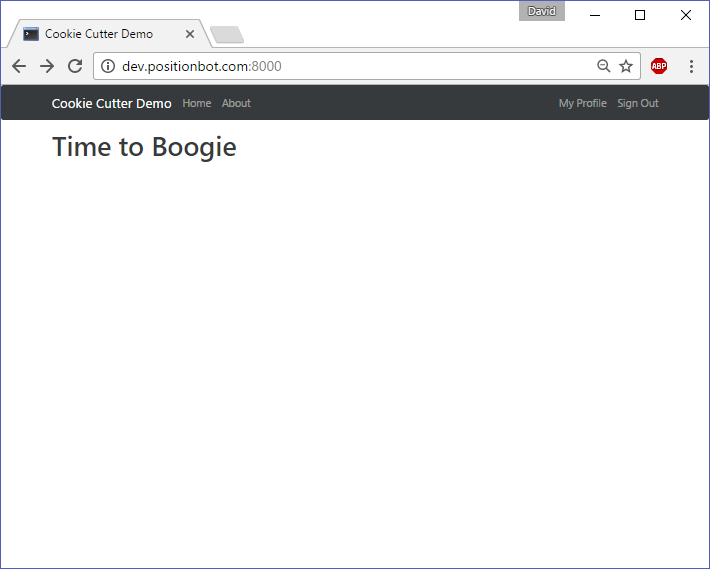
Doing the bare minimum just to see how easy this is. We will put our map on the main home page of our site using the OpenLayers library. Right now, our basic home page is generated from the cookie-cutter-demo/templates/pages/home.html file, and looks like this:
If you followed my earlier discussion of setting up GeoDjango, you’ll see we already have the OpenLayers library installed with slippy maps available through the admin tool. But we don’t want to expose the admin to just any user, so what do we need to do to put a map on the home page?
Ensure the Javascript Are Loaded
We want to keep using the existing page templates for our HTML, so the first edit will be to the file cookie-cutter-demo/templates/base.html and add the links for the style.css and OpenLayers.js files in the indicated places.
<!-- base.html -->
<!-- ... -->
      <!-- Your stuff: Third-party javascript libraries go here -->
      <script src="{% static 'js/OpenLayers.js' %}"></script>
<!-- ... -->
Write Some Javascript To Generate The Map
Perusing the base.html file, we see a reference to a file called project.js where we are intended to place our project specific javascript. We’ll follow this structure for now but in the future we may find a need to develop a different set of templates for including our code. If you have doubts about how this is all works, the Django template engine documents are pretty good. We will edit the cookie-cutter-demo/static/js/project.js file and add some code:
// static/js/project.js

var lon = -114;
var lat = 51;
var zoom = 10;
var map, layer;

function init(){
    map = new OpenLayers.Map( 'map' );
    layer = new OpenLayers.Layer.WMS( "OpenLayers WMS",
         "http://vmap0.tiles.osgeo.org/wms/vmap0",
          {layers: 'basic'} );
    map.addLayer(layer);
    map.setCenter(new OpenLayers.LonLat(lon, lat), zoom);
    var geojson_format = new OpenLayers.Format.GeoJSON();
    var vector_layer = new OpenLayers.Layer.Vector("GeoJSON", {
        projection: "EPSG:4326",
        strategies: [new OpenLayers.Strategy.Fixed()],
        protocol: new OpenLayers.Protocol.HTTP({
            url: "geodata/data.geojson",
            format: new OpenLayers.Format.GeoJSON()
        })
    });
    map.addLayer(vector_layer);
}
window.onload = init;
You will see some code already in the project.js file, but since it’s javascript, we can just insert our new code below it.
Add A Map Div To The HTML
Next, we edit the file cookie-cutter-demo/templates/pages/home.html and insert a properly named div element.
<!-- templates/pages/home.html -->
{% extends "base.html" %}

{% block content %}
<h1>Time to Boogie</h1>
<div id="map" class="smallmap" style="height:800px"></div>
{% endblock %}
Add A GeoJson Feed
Finally, we need to provide a feed for the GeoJson layer referenced in our javascript code. The URL for our feed is set as geodata/data.geojson, so lets first hook it up. Knowledge of the django url mapping scheme goes a long way here, but basically all requests get routed through the file cookie-cutter-demo/config/urls.py which can be passed on to other bits of code. We will direct any requests to geodata to be passed to our geodata app like so:
# config/urls.py

# -*- coding: utf-8 -*-
# ...

urlpatterns = [
# ...

    url(r'^geodata/', include('geodata.urls')),
]

# ...
We also need to create the referenced file geodata/urls.py as:
# geodata/urls.py

# -*- coding: utf-8 -*-
from __future__ import absolute_import, unicode_literals

from django.conf.urls import url

from . import views

urlpatterns = [
    url(r'^data.geojson$', views.geojsonFeed, name='data'),
]
Finally, we create a view called geojsonFeed in our geodata/views.py file:
# geodata/views.py
from django.shortcuts import render
from django.http import HttpResponse
from django.core.serializers import serialize

from .models import Location

# Geojson serializer
def geojsonFeed(request):
    return HttpResponse(serialize('geojson', Location.objects.all(),fields=('name','mpoint')))
We can now test our geojson feed - pointing our browser at the url geodata/data.geojson give us:
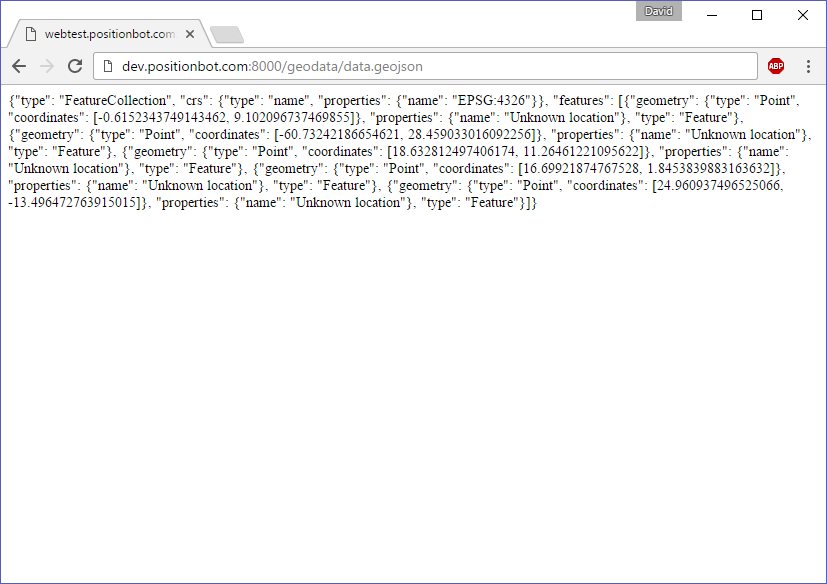
Note that I added the locations using the admin interface.
That should do it, our home page now looks like this:

Not a pretty map, but a bit of mousing will confirm it is indeed responsive. We can access the admin site and add some locations that should then show up on our front page.
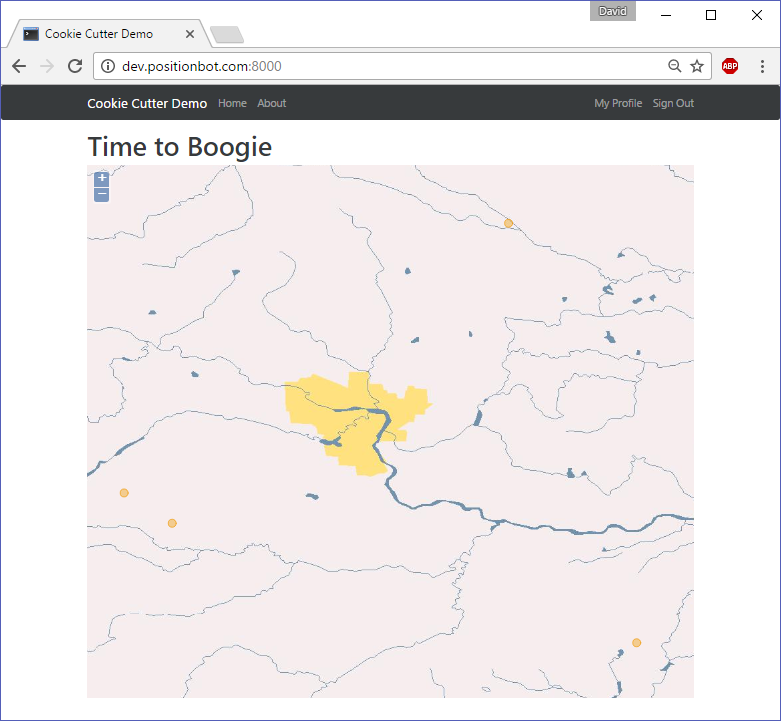
Well, it works, and I have no doubt that with some judicious tweaking of the various html, css, and javascript we could achieve a satisfactory presentation. However, and this is one of my major misgivings about GeoDjango, we are using a deprecated version of OpenLayers (2.13) rather than the current version. So I won’t take this any further. Let’s see if we can get the same result using Leaflet.
Phase 2: Serve A Minimal Slippy Map With Leaflet
Here, the requirements are very similar to those for OpenLayers:
- Ensure the css and js files are loaded
- Add our custom javascript to draw the map
- Add a <div> element to the html
- Serve a GeoJSON feed from our django site - already done
The first requirement is pretty easy. The latest leaflet libraries are hosted on a content delivery network, so we edit our cookie-cutter-demo/templates/base.html file and insert the references. Note the css goes in the <head> section while the js goes at the end of <body>.
<!-- base.html -->

<!-- ... -->
    <!-- Your stuff: Third-party CSS libraries go here -->
    <link rel="stylesheet" href="https://unpkg.com/leaflet@1.0.2/dist/leaflet.css" />
<!-- ... -->

      <!-- Your stuff: Third-party javascript libraries go here -->
      <script src="https://unpkg.com/leaflet@1.0.2/dist/leaflet.js"></script>

<!-- ... -->
Then we edit the cookie-cutter-demo/static/js/project.js, replacing the OpenLayers stuff we wrote before with the following:
// project.js
//...
var dataurl = 'geodata/data.geojson';
var lon = -114;
var lat = 51;
var zoom = 10;
var map, layer;
map = new L.map('map').setView([lat, lon], zoom);
L.tileLayer('http://{s}.tile.openstreetmap.org/{z}/{x}/{y}.png', {
attribution: '© <a href="http://www.openstreetmap.org/copyright">OpenStreetMap</a>',
maxZoom: 19,
}).addTo(map);
// Download GeoJSON data with Ajax
fetch(dataurl)
.then(function(resp) {
return resp.json();
})
.then(function(data) {
L.geoJson(data, {
onEachFeature: function onEachFeature(feature, layer) {
var props = feature.properties;
var content = `<h3>${props.name}</h3>`;
layer.bindPopup(content);
}}).addTo(map);
});
No need to mess with the Django stuff as we should already have a geojson feed. Looking at our new homepage, we have some leaflet happening:
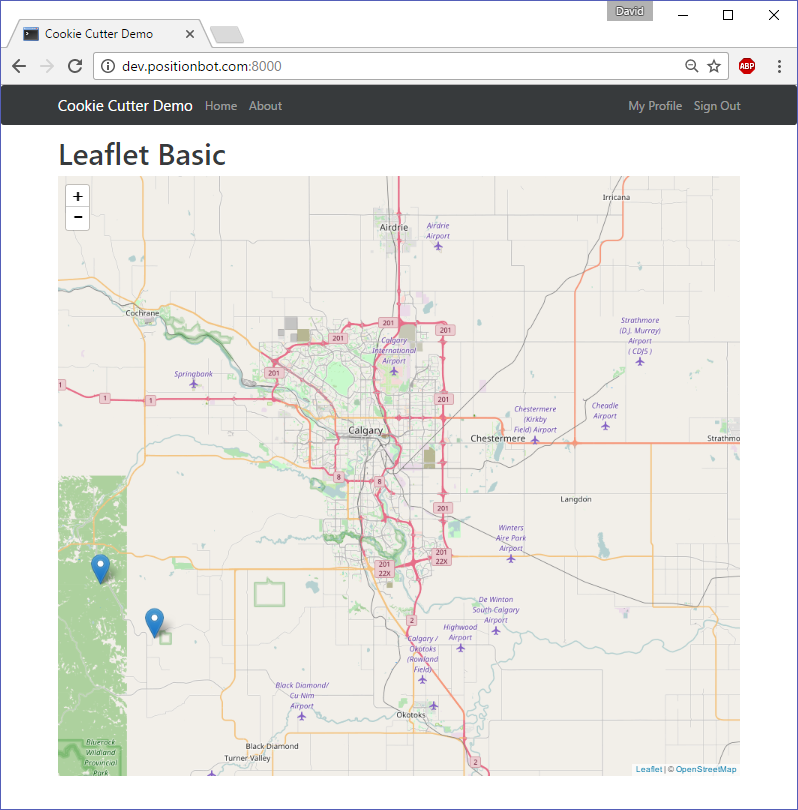
The points I put in the database are also showing up, and have popups bound to the mouse click. Note that there isn’t really much functional difference between the OpenLayers map and the Leaflet version other than some styling and I believe either library is a good choice for this application. But I want to do much more than these simple examples, so let’s move on to the next phase.
Phase 3: Integrate the Django-Leaflet Package
The django-leaflet package promises to provide full django integration, making it easy to use leaflet in both the admin and on user built pages and forms. To use it, we will need to rebuild our django container. First we will stop our docker-containers:
$ docker-compose -f dev.yml stop
A note about the starting and stopping docker containers. In previous steps, I used the
docker-compose downcommand to stop all the containers, and delete their images, which also deletes all of the data stored in the database. This is a good idea during development, but if we know we will want to have that data available (and we aren’t changing the database structure) then usingdocker-compose stopfollowed bydocker-compose startwill save some effort.
Add Django-leaflet To The Requirements And Rebuild
Now we edit the cookie-cutter-demo/requirements/base.txt file and add django-leaflet to the list.
# requirements/base.txt
# ...
# Your custom requirements go here
django-leaflet
Once the file is saved, we can rebuild the containers and bring them up.
$ docker-compose -f dev.yml build
$ docker-compose -f dev.yml up -d
Set Up Our Preferred Leaflet Configuration
We’ll edit the config/settings/common.py file and make a few changes:
- Add ‘leaflet’ to our list of 3rd Party Apps,
- Add leaflet related options at the end of the file, like so:
# config/settings/common.py
# ...
THIRD_PARTY_APPS = (
'crispy_forms', # Form layouts
'allauth', # registration
'allauth.account', # registration
'allauth.socialaccount', # registration
'leaflet', # django-leaflet
)
# Apps specific for this project go here.
LOCAL_APPS = (
# custom users app
'cookie_cutter_demo.users.apps.UsersConfig',
# Your stuff: custom apps go here
'geodata',
)
# ...
# Your common stuff: Below this line define 3rd party library settings
# ------------------------------------------------------------------------------
# Settings for Django-leaflet -- see https://github.com/makinacorpus/django-leaflet
LEAFLET_CONFIG = {
'DEFAULT_CENTER': (51.0, -114.0),
'DEFAULT_ZOOM': 10,
'MIN_ZOOM': 3,
'MAX_ZOOM': 18,
'TILES': [('OpenStreetMap', 'http://{s}.tile.openstreetmap.org/{z}/{x}/{y}.png', {'attribution': '© <a href="http://www.openstreetmap.org/copyright">OpenStreetMap</a>', 'maxZoom': 19}),
('Toner', 'http://stamen-tiles-{s}.a.ssl.fastly.net/toner/{z}/{x}/{y}.png', {'attribution': 'Map tiles by <a href="http://stamen.com">Stamen Design</a>, ' +
'<a href="http://creativecommons.org/licenses/by/3.0">CC BY 3.0</a> — ' +
'Map data {attribution.OpenStreetMap}','maxZoom': 20 }),
('Terrain', 'http://stamen-tiles-{s}.a.ssl.fastly.net/terrain/{z}/{x}/{y}.png', {'attribution': 'Map tiles by <a href="http://stamen.com">Stamen Design</a>, ' +
'<a href="http://creativecommons.org/licenses/by/3.0">CC BY 3.0</a> — ' +
'Map data {attribution.OpenStreetMap}','maxZoom': 18 }) ],
'SCALE': 'both',
'ATTRIBUTION_PREFIX': 'Powered by django-leaflet',
'MINIMAP': True,
}
Change Our HTML And Templates
Going back to the original template file templates/base.html we will make one change in each of the <head> and <body> sections, overwriting the work done previously. Here is what the the relevant sections look like now:
<!-- templates/base.html -->
{% load staticfiles i18n %}<!DOCTYPE html>
<html lang="en">
{% load leaflet_tags %}
  <head>
    <meta charset="utf-8">
    <meta http-equiv="x-ua-compatible" content="ie=edge">
    <title>{% block title %}Cookie Cutter Demo{% endblock title %}</title>
    <meta name="viewport" content="width=device-width, initial-scale=1.0">
    <meta name="description" content="">
    <meta name="author" content="">

    <!-- HTML5 shim, for IE6-8 support of HTML5 elements -->
    <!--[if lt IE 9]>
      <script src="https://cdnjs.cloudflare.com/ajax/libs/html5shiv/3.7.3/html5shiv.min.js"></script>
    <![endif]-->

    {% block css %}
    <!-- Latest compiled and minified Bootstrap 4 Alpha 4 CSS -->
    <link rel="stylesheet" href="https://maxcdn.bootstrapcdn.com/bootstrap/4.0.0-alpha.4/css/bootstrap.min.css" integrity="sha384-2hfp1SzUoho7/TsGGGDaFdsuuDL0LX2hnUp6VkX3CUQ2K4K+xjboZdsXyp4oUHZj" crossorigin="anonymous">

    <!-- Your stuff: Third-party CSS libraries go here -->
    {% leaflet_css %}
    <!-- This file stores project-specific CSS -->
    <link href="{% static 'css/project.css' %}" rel="stylesheet">
    <style>
    .leaflet-container {  /* all maps */
        width:  100%;
        height: 600px;
    }
    </style>
    {% endblock %}
  </head>

<!-- ... -->
      {% block content %}
        <p>Use this document as a way to quick start any new project.</p>
      {% endblock content %}
      {% leaflet_map "yourmap" %}
    </div> <!-- /container -->

    {% block modal %}{% endblock modal %}


    <!-- Le javascript
    ================================================== -->
    <!-- Placed at the end of the document so the pages load faster -->
    {% block javascript %}
      <!-- Required by Bootstrap v4 Alpha 4 -->
      <script src="https://ajax.googleapis.com/ajax/libs/jquery/3.1.1/jquery.min.js" integrity="sha384-3ceskX3iaEnIogmQchP8opvBy3Mi7Ce34nWjpBIwVTHfGYWQS9jwHDVRnpKKHJg7" crossorigin="anonymous"></script>
      <script src="https://cdnjs.cloudflare.com/ajax/libs/tether/1.3.7/js/tether.min.js" integrity="sha384-XTs3FgkjiBgo8qjEjBk0tGmf3wPrWtA6coPfQDfFEY8AnYJwjalXCiosYRBIBZX8" crossorigin="anonymous"></script>
      <script src="https://maxcdn.bootstrapcdn.com/bootstrap/4.0.0-alpha.4/js/bootstrap.min.js" integrity="sha384-VjEeINv9OSwtWFLAtmc4JCtEJXXBub00gtSnszmspDLCtC0I4z4nqz7rEFbIZLLU" crossorigin="anonymous"></script>

      <!-- Your stuff: Third-party javascript libraries go here -->
      {% leaflet_js %}

      <!-- place project specific Javascript in this file -->

      <script src="{% static 'js/project.js' %}"></script>


    {% endblock javascript %}

<!-- ... -->
Four changes here:
- Added the instruction to
load leaflet_tagsat the beginning of the file, - Added the
leaflet_csstag to the head, plus some extra css (see below), - Added the
leaflet_maptag to the body. I only did this in the template because I can’t get it to work inside a block withinhome.html. This is something that will need to be figured out. - Added the
leaflet_jstag to the end of the body.
Note that I was lazy and just inserted some css directly into the template, rather than what I should have done which is to put it in the css/project.css file. Since I anticipate there will be lots of edits relating to styling and layout, I’m sure this will get cleaned up later.
Next up is the templates/pages/home.html file, which now looks like this:
<!-- templates/pages/home.html -->
{% extends "base.html" %}

{% block content %}
<h1>Django-Leaflet Magic</h1>

{% endblock %}
Add Some Javascript To Put Our Locations On The Map
Finally, I’ll replace the javascript we put into the js/project.js file earlier with the following code:
// js/project.js

var dataurl = '/geodata/data.geojson';
window.addEventListener("map:init", function (event) {
    var map = event.detail.map;
    // Download GeoJSON data with Ajax
    fetch(dataurl)
        .then(function(resp) {
            return resp.json();
        })
        .then(function(data) {
             L.geoJson(data, {
                onEachFeature: function onEachFeature(feature, layer) {
                  var props = feature.properties;
                  var content = `<h3>${props.name}</h3>`;
                  layer.bindPopup(content);
              }}).addTo(map);
        });
});
Test It Out
Here is what the home page looks like now:
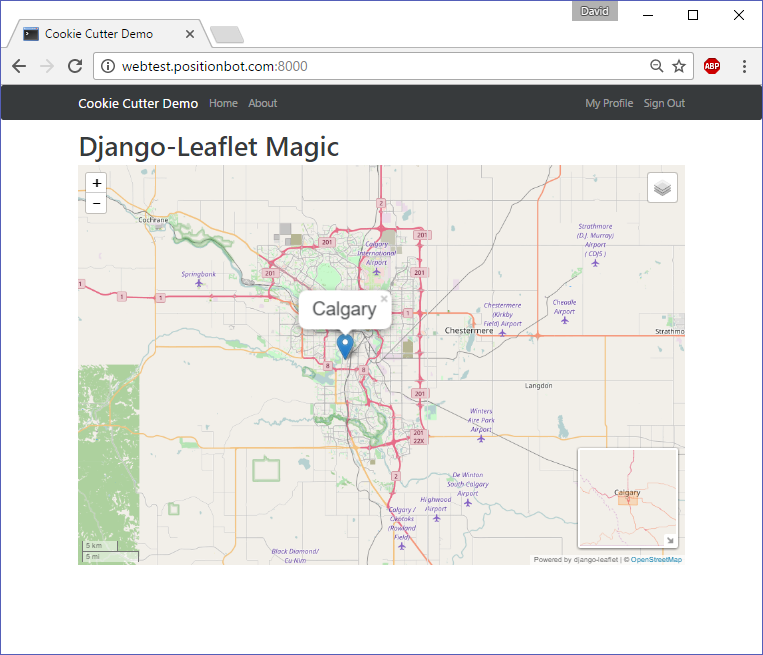
Some nice features of this implementation include the minimap plugin plus the easy ability to configure tile layers and other implementation details in one place - the django settings file. I think this will be a good solution going forward, although I really need to figure out how to get the django-leaflet template tags to work within other templates so that I can get that leaflet_map tag out of the base.html template.
Bring Up The Secure Site
Now that I have an app, simple as it is, I will stop the docker containers and bring up the full production setup with encryption. There is just one tweak that needs to be done to the config/settings/production.py file as shown:
# config/settings/production.py

# ...

# Static Assets
# ------------------------
# DHC Commented this out - doesn't work with django-leaflet
# STATICFILES_STORAGE = 'whitenoise.storage.CompressedManifestStaticFilesStorage'

# ...
The reason seems to be a problem with django-leaflet not using lazy installation of assets which causes static files to be lost when whitenoise is used. There is some effort ongoing to fix it, but for now this fixes the problem at the expense of not having our static assets compressed.
$ docker-compose -f dev.yml down
$ docker-compose build
$ docker-compose up -d
$ docker-compose ps
$ docker-compose run django python manage.py makemigrations
$ docker-compose run django python manage.py migrate
$ docker-compose run django python manage.py createsuperuser
The container list looks good:
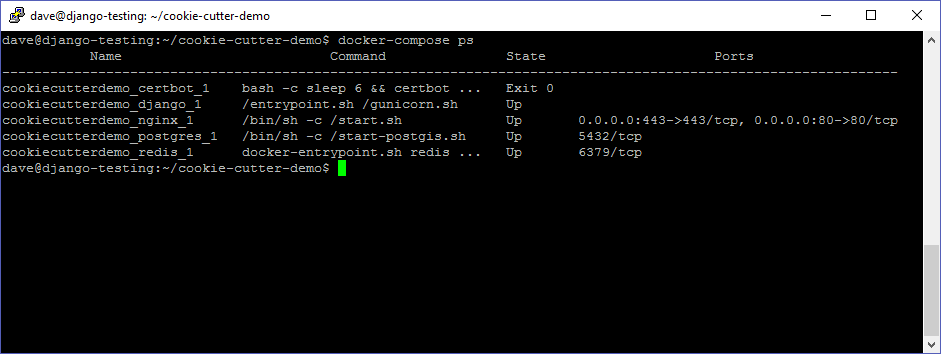
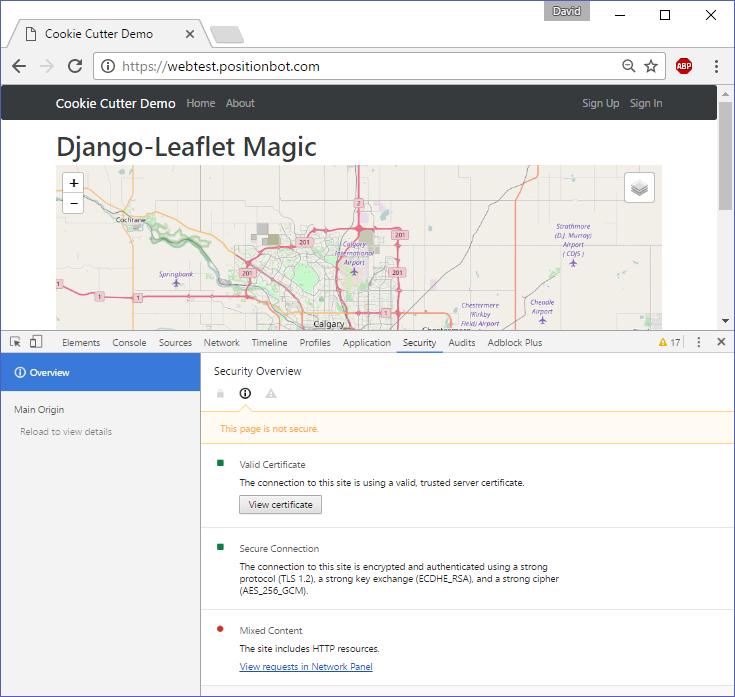
And our site is up with a secure certificate, although the browser reports that it is requesting HTTP resources which are not secure. Since these are the raster map tiles, I think that should be fine.
Final Thoughts
Well I didn’t achieve all of my goals, which would involve capturing mouse clicks on the map and using the coordinate to perform a spatial query. I’ll leave that exercise for a future post. Some issues that do need to be addressed with the existing site include:
- managing database backups and permanent data storage
- configuring MailGun so that the email user signup functions can work